Unseen and undesired pt. 1
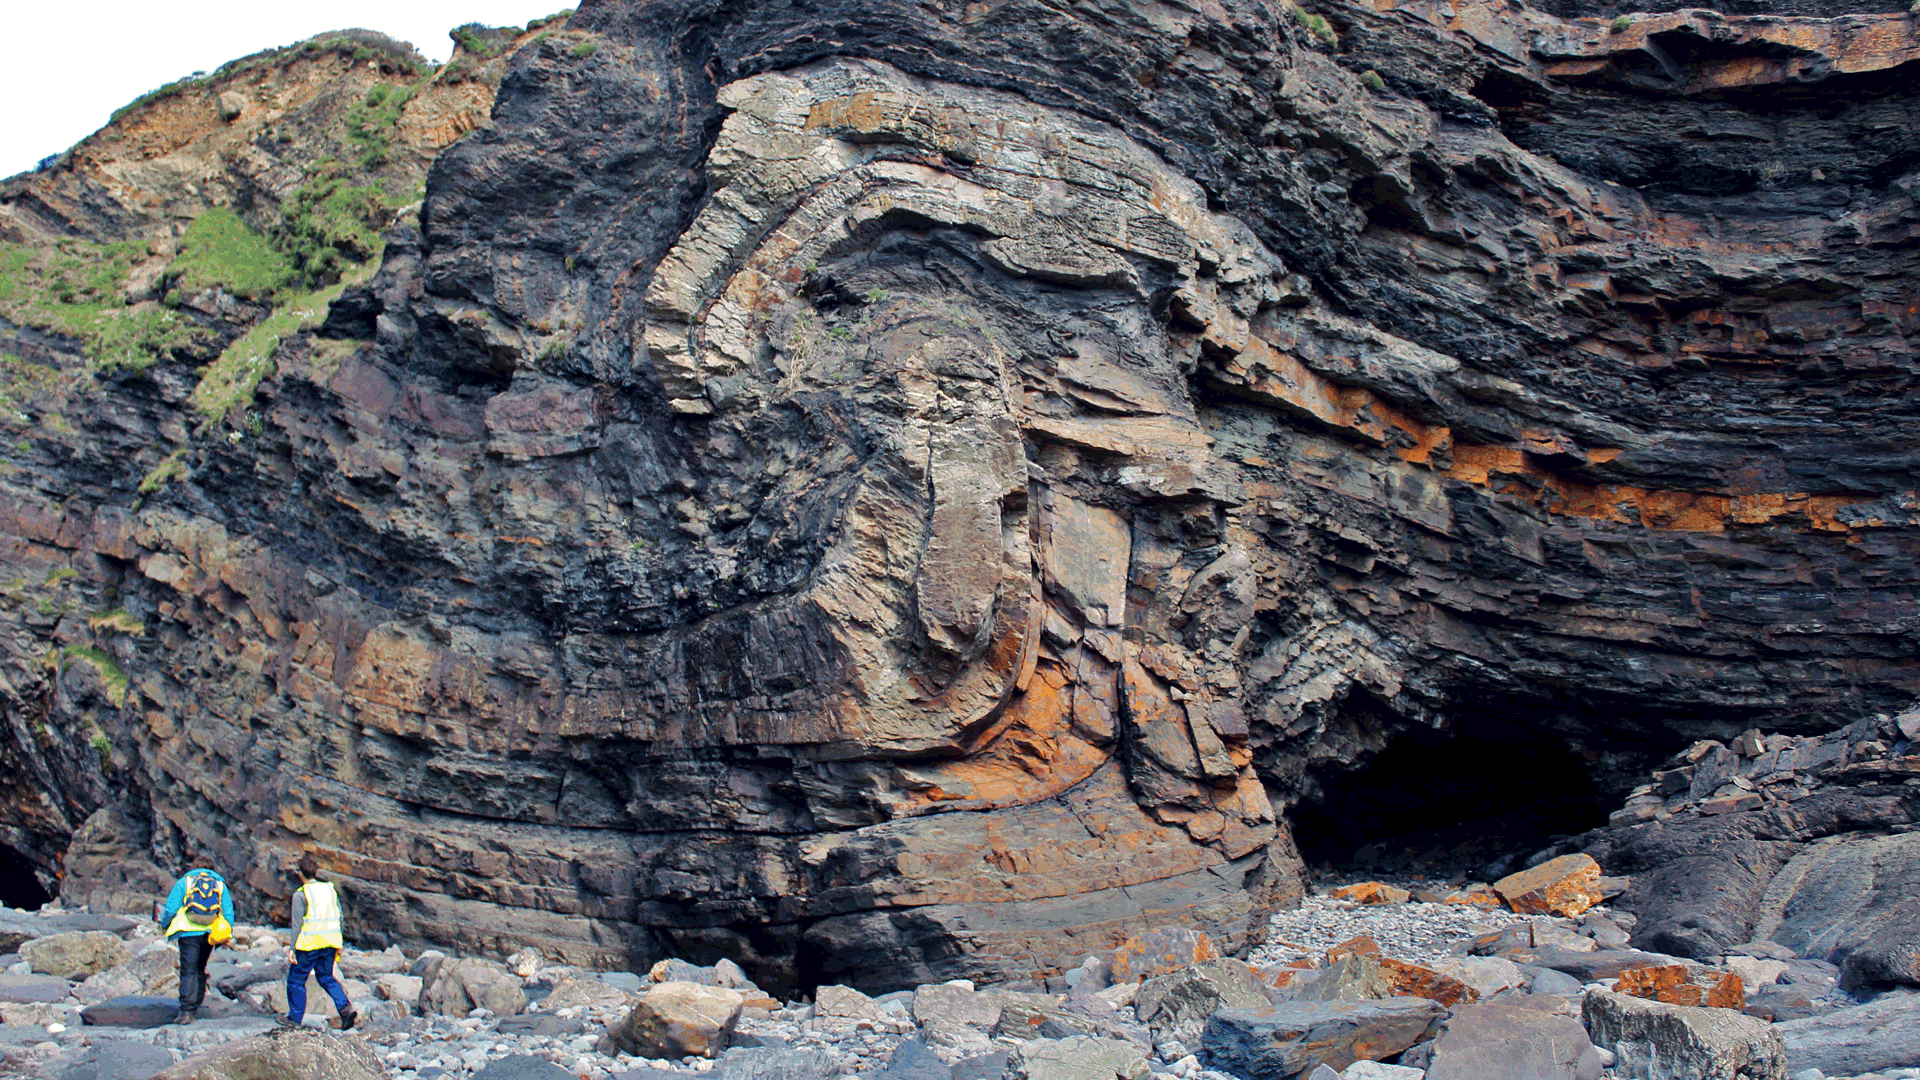
Cork sightseeing
The following bit is just to explain a bit further.
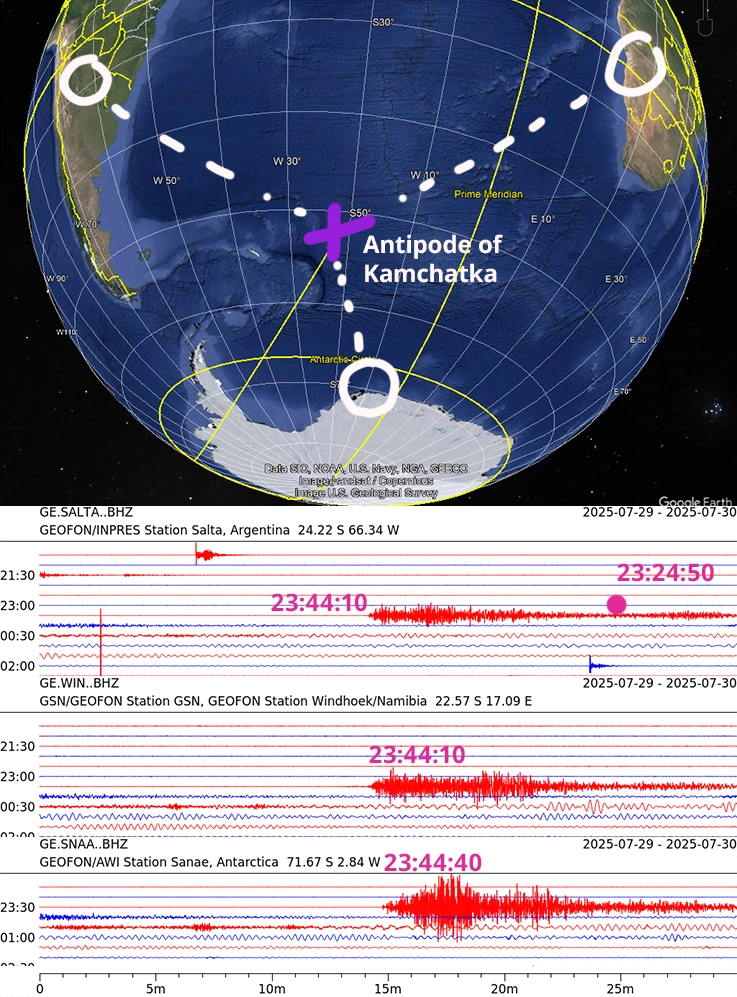
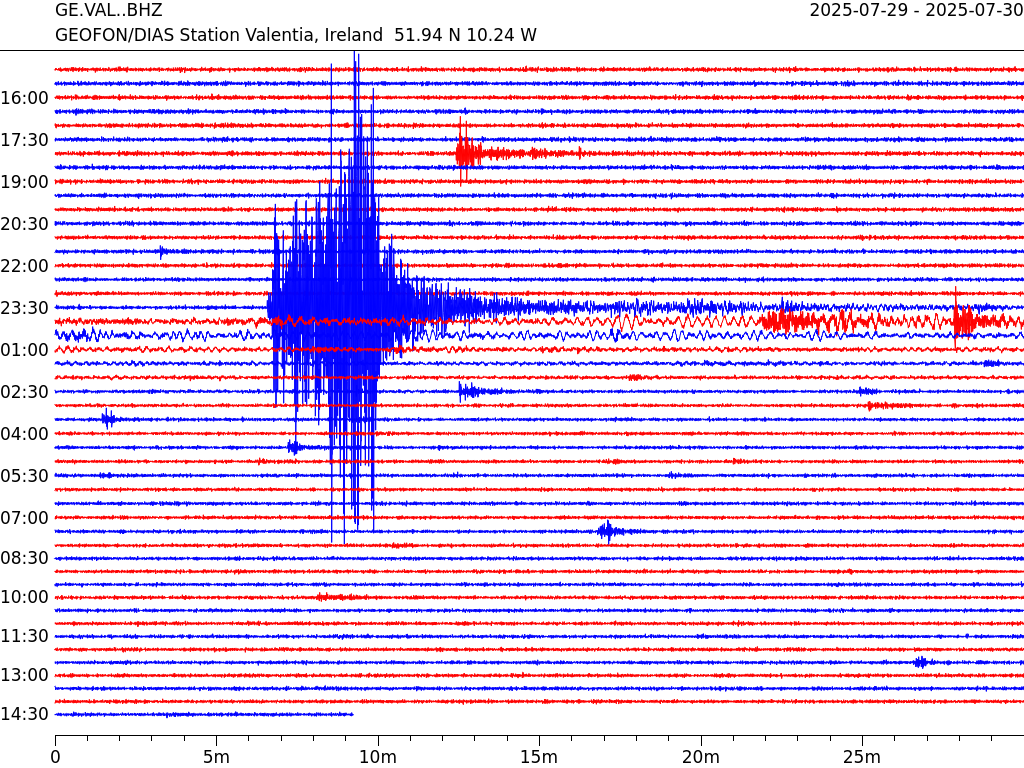
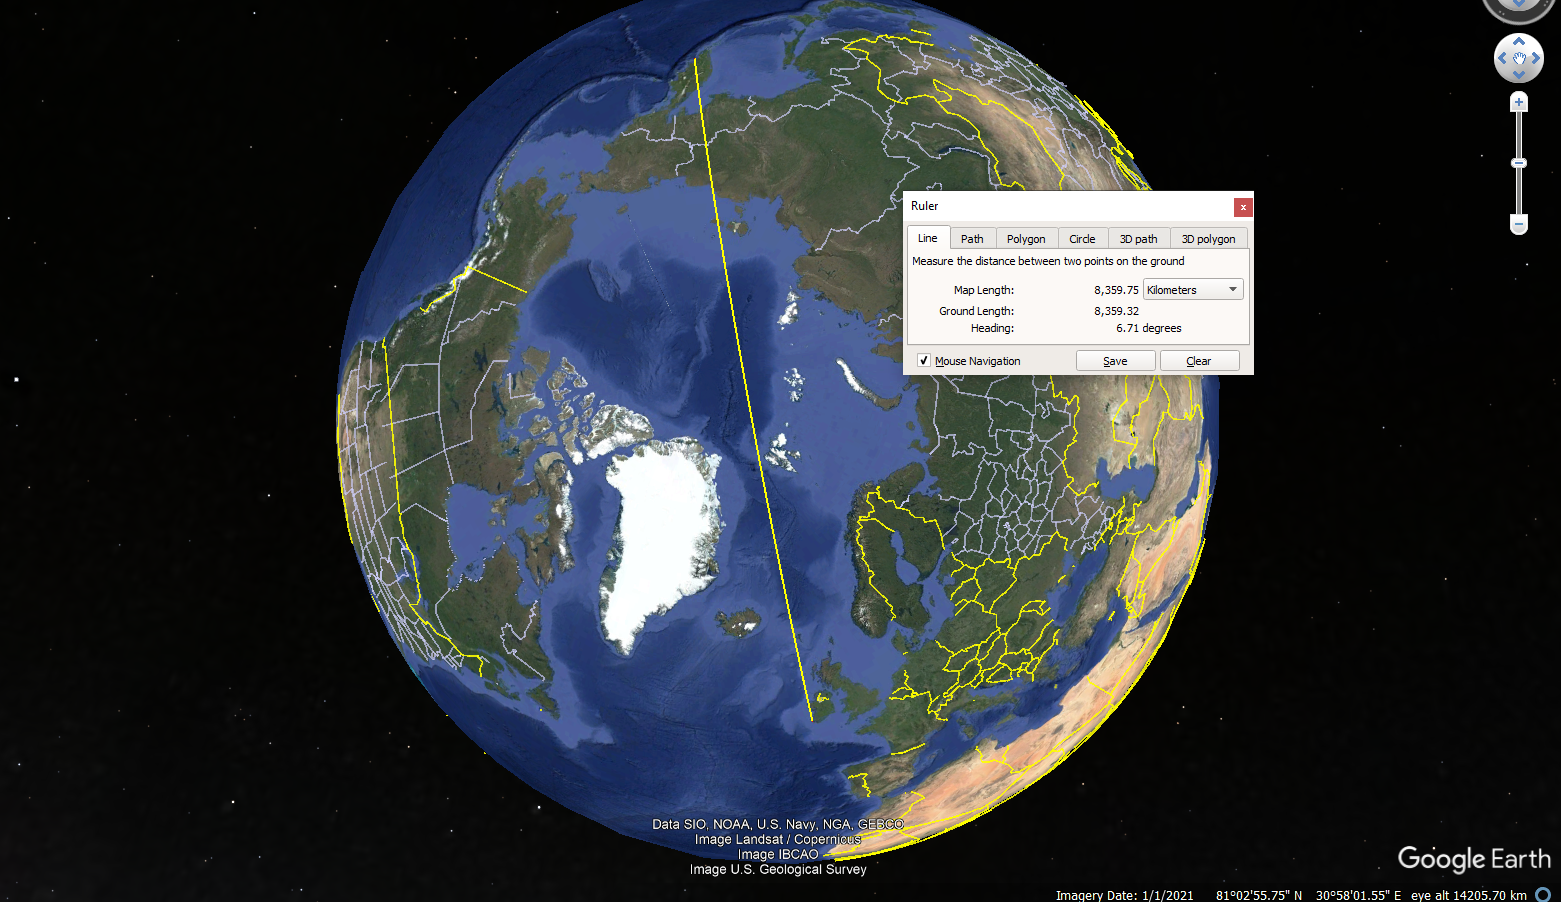
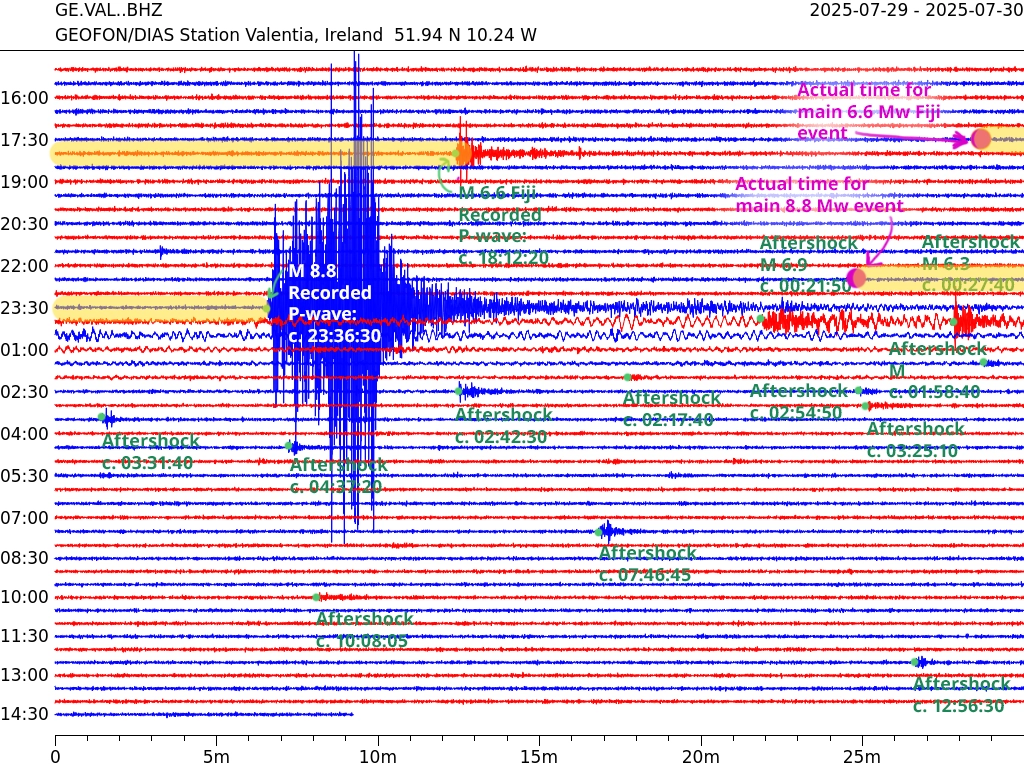
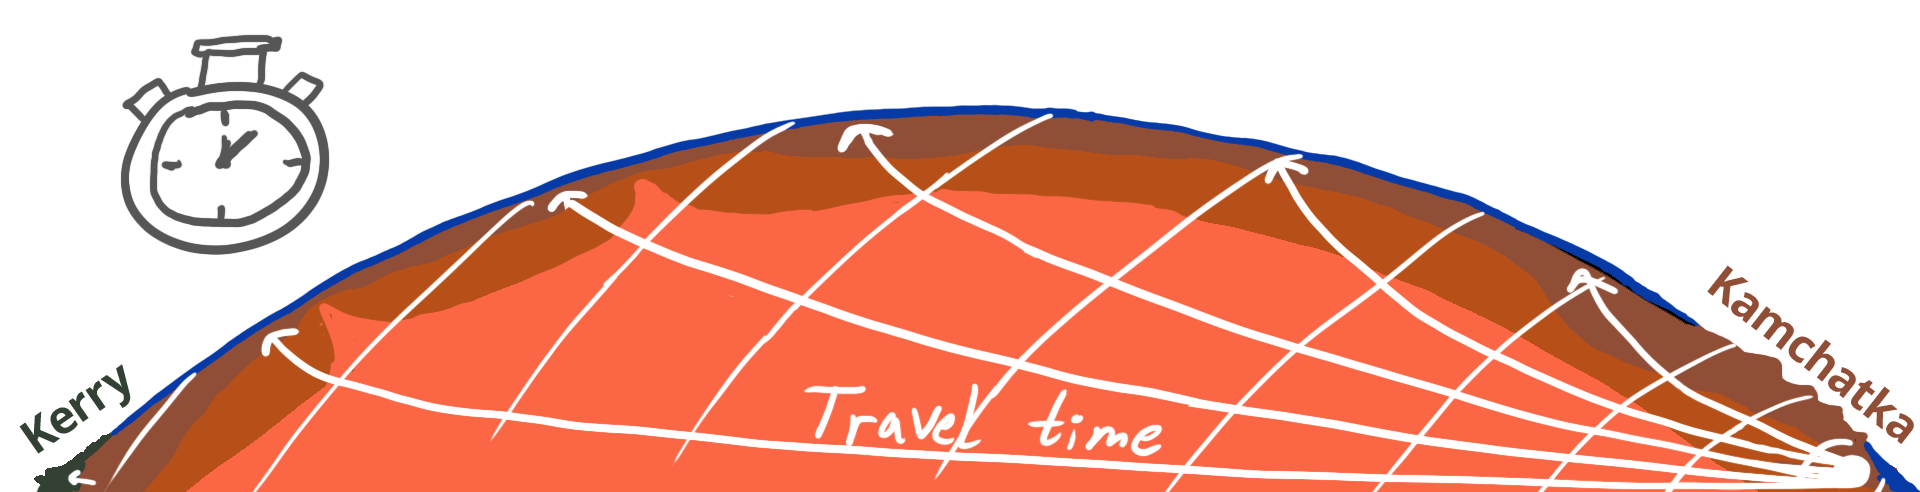
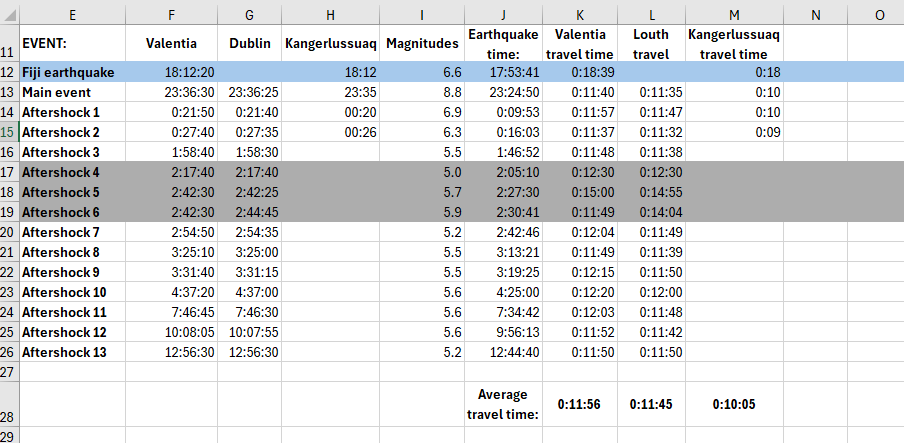
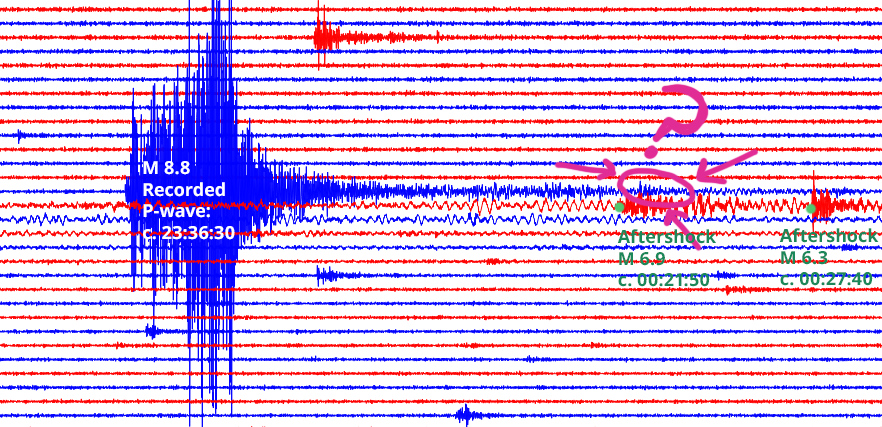
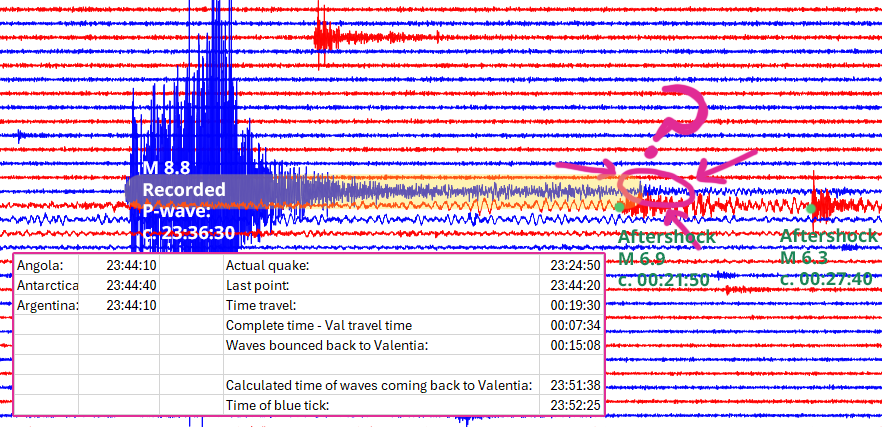
The GEOFON project conveniently has seismograms from locations closer to the point of the planet opposite the earthquake (the antipode). As such, I “triangulated” the arrival times of the seismic waves. According to these calculations, it took the first seismic waves about 19 and half minutes to reach from the epicentre to the opposite side of the planet!
Wild.
I then calculated the time travelled from Valentia Island to the antipode and got 7 and a half minutes. Doubling that and I get the calculated time that the waves returned to Valentia Island.
There’s less than a minute of discrepancy here, which I can live with considering that the Earth is not uniform inside.
A lot of variations in the crust and mantle can slow or increase wave velocities.
References: